

Looplex Visual Law
Create charts, timelines, and diagrams to understand and communicate legal information with AI.
Looplex Visual Law lets you create visual representations of legal information with artificial intelligence. Through the Assistant, you can turn data, facts, relationships, and process stages into charts, timelines, diagrams, and other presentation formats.
Describe what you need to understand or communicate, identify the relevant material, and refine the result through conversation. Each visualization is created to meet the needs of the task, including a specific pleading or contract.
Explore an example
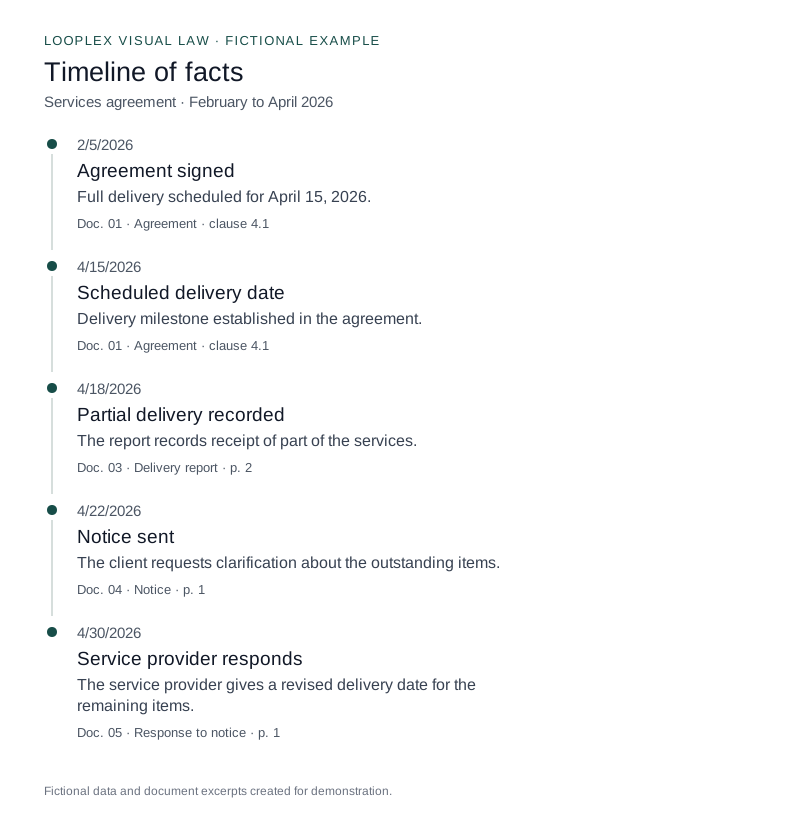
See how a timeline can support case analysis and become part of a pleading. Select facts, review their sources, and switch to the static version. The data and documents in this example are fictional; interactions run in your browser.
What you can create
The format follows the information and the purpose of your work. Applications include:
| Application | Visualization examples |
|---|---|
| Pleadings and court submissions | A timeline of facts, a diagram of relationships between the parties, and a chart of the amounts in dispute. |
| Contracts | A map of obligations and responsibilities, a delivery schedule, and a comparison of contract terms. |
| Proposals | A comparison of alternatives, a breakdown of amounts, and a presentation of execution stages. |
| Presentations and memoranda | A visual summary of an analysis, a comparison of scenarios, and a transaction diagram. |
| Analysis in the Assistant | Charts with filters, explorable timelines, and views that let you compare information during the conversation. |
You can choose a format or ask the Assistant to suggest a representation suited to your objective.
How it works
1. Identify the material and purpose
Provide the documents or data to consider and explain what the visualization needs to show.
Context helps determine the level of detail, audience, and presentation format. A timeline used to study a case may highlight more events than the version intended for a pleading.
For example:
“Using the documents in this case, create a timeline of the facts relevant to the pleading. Include dates, a short description of each event, and a reference to the corresponding document.”
2. Explore and refine the result
Continue the conversation to adjust the content and presentation. You can ask to group information, highlight a relationship, change the scale, simplify labels, or compare scenarios.
For example:
“Group the events by stage, highlight the notices, and keep the references to the source documents.”
Or:
“Compare these two proposals in a chart and show how the amounts change depending on the contract term.”
3. Prepare the visualization for its intended use
Specify whether the result will be used in a document or during your interaction with the Assistant. This guides the presentation of information and the choice of visual features.
Visual materials for documents
You can create materials to incorporate into pleadings, contracts, proposals, presentations, and memoranda, saving or exporting the results for their intended use.
In this context, the visualization should communicate the information fully within the document. Titles, legends, values, dates, and relevant references need to remain understandable in the final version.
For a pleading in PDF format, for example, you can request:
“Prepare a static version of this timeline to insert into the pleading, with legible text on one page and references to the sources.”
A static version can present the information as a chart, image, or diagram. When the interactive version contains multiple filters or details, the Assistant can help select and organize the content needed for the document.
Before using the material, check the data, dates, relationships shown, and their correspondence with the sources.
Using PDFs for court filing
For documents intended for electronic court filing, prepare a static version that keeps essential information visible. Readers should be able to understand the content from the page, with the necessary legends and explanations.
Check the format and file size requirements of the destination court’s filing system and review legibility in the final PDF. Preparation should account for the complete document, including the placement and size of each visual element.
Interactive visualizations in Workbench
When you use the Assistant in Workbench, visualizations can also be part of the interaction itself.
In this experience, you can explore data, adjust filters, compare alternatives, and see how a change affects the information presented. The visualization helps guide your analysis and determine the next step in the task.
For example, the Assistant can present a view of the obligations in a contract for you to explore by responsible party or period. In another task, it can organize the events in a case to help you select the facts to highlight in a pleading.
The available interactions follow the experience provided by Looplex for each context.
Visual Law and dashboards
Looplex Visual Law supports the creation of visual representations to understand and communicate information in legal work.
To track metrics and analyze operations, Looplex also offers standard dashboards, dashboards developed through consulting services, and views created by users with the Assistant. Learn about these options in Looplex Dashboards.
Accessing Visual Law
AI visualization creation is available through the Assistant, which is being rolled out gradually to the entire customer base.
To get started, identify the material you want to use and describe the expected result. You can ask for an initial visual proposal and refine it in the same conversation until the presentation fits your task.